Delaware ranks as the US’s most competitive region regarding inward investment attraction. Its score of 3.38 places it ahead of South Carolina (2.64) and Kentucky (2.33). Delaware’s score means that it is attracting more than three-times its fair share of national greenfield foreign direct investment (FDI) projects given the size of its economy.
Delaware is one of the smallest US states, ranking 45th out of 50 in terms of population. It is known for its tax-friendly business environment, which is an attractive factor for foreign investors. However, it is certainly not a regional economic powerhouse. The state ranks 43rd in terms of economic output, or gross domestic product (GDP). Nevertheless, its GDP per capita equates to $87,230, the eighth largest in the US.
In recent years, Subaru has announced the creation of a wholly owned subsidiary in Delaware, while Ireland-based Cora Systems expanded its workforce in the state by adding 150 new jobs in Wilmington. All greenfield FDI into Delaware in 2022 was office-based establishments.
BMW and Canfor boost South Carolina's FDI
South Carolina ranks second in the index with a score of 2.64. The south-eastern state attracted more than three-times the number of inbound projects as Delaware. However, its GDP of $295bn is four times larger than the number one ranking state. South Carolina attracted 53 projects in 2022, and Germany and Canada were key source markets for investment into the state.
BMW announced plans to invest $200m to expand its existing Spartanburg manufacturing facility in 2022, while Canfor Southern Pine, a subsidiary of Canada-based Canfor, announced a $25m modernisation of its Estill facility to meet growing demand for its wood products.
South Carolina saw its number of inbound FDI projects surpass pre-Covid levels for the first time in 2022.
How well do you really know your competitors?
Access the most comprehensive Company Profiles on the market, powered by GlobalData. Save hours of research. Gain competitive edge.

Thank you!
Your download email will arrive shortly
Not ready to buy yet? Download a free sample
We are confident about the unique quality of our Company Profiles. However, we want you to make the most beneficial decision for your business, so we offer a free sample that you can download by submitting the below form
By GlobalDataLarger US states not necessarily the best performing
Only four US states recorded more than 100 inbound projects in 2022: California, Florida, New York and Texas. These four states are also the largest states in terms of population and GDP. Foreign investment and market size (of which GDP is a proxy) are highly correlated. Therefore, it is unsurprising that the largest US states receive the most FDI projects.
Yet of these, only California was underperforming in terms of inward investment expectations. The Golden State scored 0.73 in the index, while the other three states scored above one.
What are the most competitive states in the US for FDI?
Of the US states, 18 have recorded an index score above one, meaning they received more of their fair share of national inward investment in 2022. The list includes several small states such as North Dakota, Rhode Island, Vermont, West Virginia and Wyoming. Although none of these states received more than seven inbound projects in 2022, they are all comparably smaller states, with populations below one million people.
Eight US states consistently outperform when it comes to FDI attraction
Between 2019 and 2022, only eight US states (plus the District of Columbia) continually outperformed in terms of inward investment. These states are all in the south (Alabama, Georgia, Kentucky, North Carolina, South Carolina and Texas) or north-east (Massachusetts and New York).
Methodology
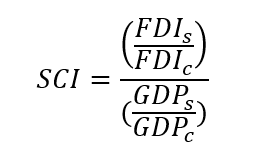
A state competitiveness index (SCI) score is calculated for each US state. The calculation is based on the number of inward greenfield FDI projects a state receives as a share of the country total. This value is then divided by the state’s proportion of economic output (GDP). A score above one indicates that the state is receiving more FDI than would be expected given the size of its economy (it is overperforming). To the contrary, a score less than one indicates a state is underperforming in terms of the amount of inward investment it receives given the size of its economic output.

The SCI is where FDI is the number of inbound greenfield FDI projects; GDP is gross domestic product; s is the state; and c is the country.


